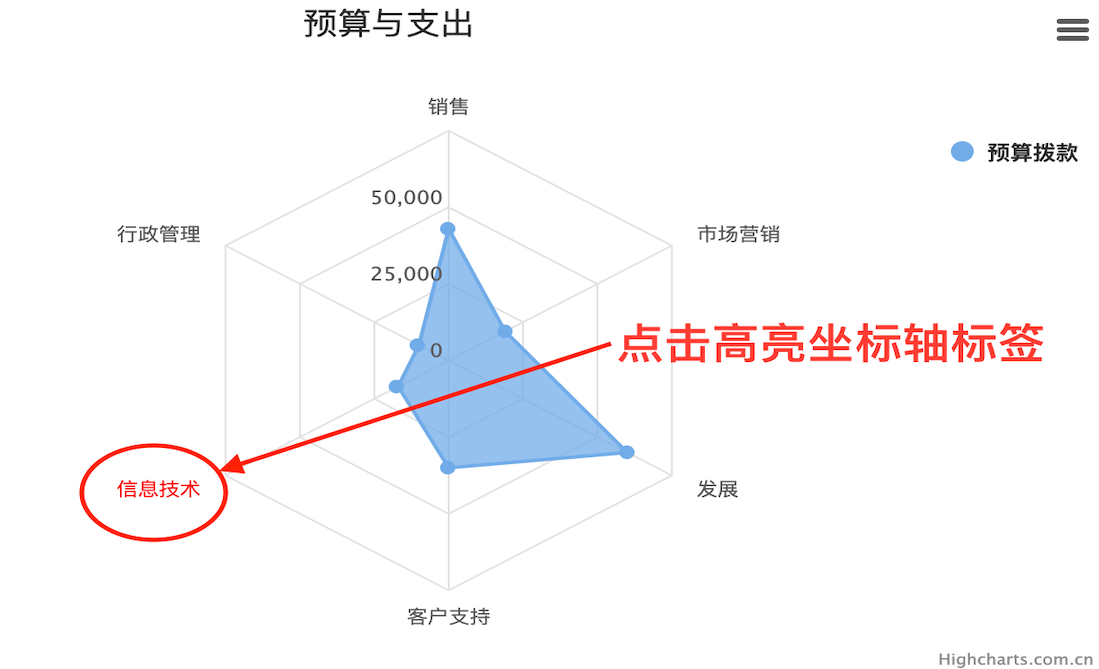
如何实现坐标轴标签点击高亮呢?下面以蜘蛛图为例,介绍两种实现方法。
方法1:给轴标签添加 a 标签
实现方法是自动坐标轴标签格式化函数,给轴标签加 a 标签,并在 href 里执行 JS 函数,步骤如下:
- 自定义轴标签格式化,添加 a 标签
1
2
3
4
5
6
7
8
| xAxis: {
labels: {
formatter: function() {
retrun '<a href="javascript: highlightCategory('+ this.pos +')">' + this.value + '</a>';
}
}
}
|
其中 highlightCategory 为点击轴标签时执行的函数,参数中当前轴标签的下标。不同类型的坐标轴参数值有所不同,具体可以 console.log(this) 参考
- highlightCategory 函数更新坐标轴并记录当前选中的分类
1
2
3
4
5
6
7
8
9
| function highlightCategory(category) {
let xAxis = chart.xAxis[0];
if(xAxis.userOptions.selectedX && xAxis.userOptions.selectedX === category) {
return false;
}
xAxis.update({
selectedX: category
});
}
|
- 高亮显示当前选中的标签
在轴标签格式化里判断当前是否是选中的标签,如果是则高亮显示
1
2
3
4
5
6
7
8
9
10
| xAxis: {
labels: {
formatter: function() {
if(this.axis.userOptions.selectedX === this.pos) {
return '<a href="javascript: void(0)" style="color: red">'+this.value+'</a>';
}
retrun '<a href="javascript: highlightCategory('+ this.pos +')">' + this.value + '</a>';
}
}
}
|
注:第 3 步中之所以能这么写的原因是第 2 步中调用坐标轴的更新函数会触发坐标轴重绘,也就是会再一次执行轴标签格式化
在线试一试
ps: 如果需要点击数据点时也高亮显示对应的轴标签,在数据点点击事件里处理即可,具体参考上面的例子。
方法2:直接给轴标签绑定点击事件
实现方法是找到轴标签 DOM,然后手动添加点击事件并处理。其中 x 轴标签的 DOM 是 axis.labelGroup.element, 添加事件我们用 Highcharts.addEvent,
实现代码如下:
1
2
3
4
5
6
7
8
9
10
11
12
13
14
15
16
17
18
19
20
21
22
23
24
25
| Highcharts.addEvent(chart.xAxis[0].labelGroup.element, 'click', function(e) {
let target = e.target;
if(target.tagName === 'text') {
if(target.classList.contains('active')) {
return false;
}
let category = target.innerHTML,
labels = target.parentNode.childNodes,
i = 0,
total = labels.length;
for(; i < total; i++) {
if(labels[i].classList.contains('active')) {
labels[i].classList.remove('active');
break;
}
}
target.classList.add('active');
}
});
|
另外还需要加上相应的 css
1
2
3
4
5
6
| .highcharts-xaxis-labels text {
cursor: pointer!important;
}
.highcharts-xaxis-labels .active {
fill: red!important;
}
|
在线试一试
相关内容
- 坐标轴标签格式化 API
- Highcharts.addEvent API